Japanese Candlestick Charting Techniques: How to Read Market Psychology in Price Action
What if you could see fear, greed, hope, and indecision directly in a price chart? Not through complex indicators or mathematical formulas, but through simple visual patterns that reveal what buyers and sellers are actually feeling?
That’s the power of Japanese candlestick charts. For centuries, rice traders in Japan used these patterns to read market sentiment. Today, they’re one of the most powerful tools in technical analysis — used by institutional traders, hedge funds, and retail investors worldwide.
Here’s how to decode the visual language of market psychology.
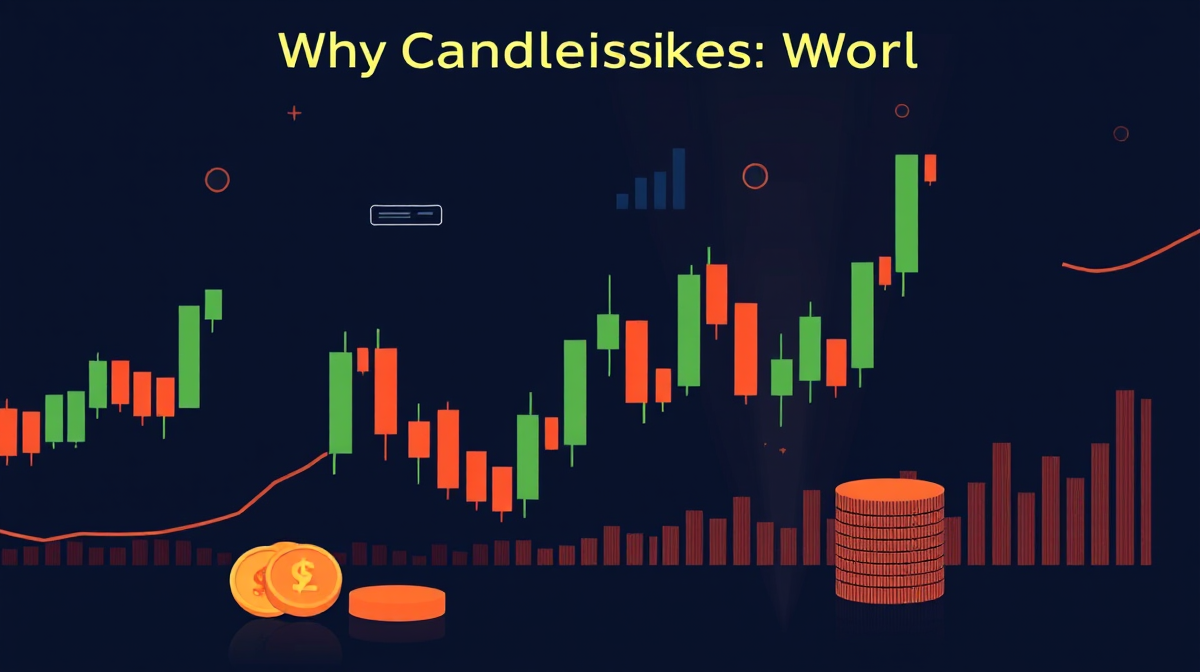
What Are Candlestick Charts?
Candlestick charts originated in 18th-century Japan when rice traders needed a better way to visualize market data. Each “candlestick” represents price action for a specific time period — one day, one hour, one minute — and tells a complete story about the battle between buyers and sellers.
Every candlestick contains four key data points:
Open — The price at the start of the period
High — The highest price during the period
Low — The lowest price during the period
Close — The price at the end of the period
The “body” of the candlestick represents the range between open and close. The “wicks” or “shadows” show how far price moved beyond the body during the period. The color indicates direction: typically green (or white) for bullish closes and red (or black) for bearish closes.
This visual format makes market psychology immediately apparent in ways that bar charts or line charts simply can’t match.
Bullish Reversal Patterns
These patterns appear after a downtrend and suggest that buyers are regaining control:
Hammer
A small body near the top of the range with a long lower wick. It looks like a hammer — and it acts like one, driving the price upward. The long lower wick shows that sellers pushed price down significantly, but buyers fought back and closed near the high. This signals potential bullish reversal.
Bullish Engulfing
A two-candle pattern where the second candle completely “engulfs” the first. The first candle is bearish (red). The second is bullish (green) and larger, opening below the first candle’s close and closing above its open. This shows overwhelming buying pressure.
Morning Star
A three-candle pattern indicating a bottom. First, a long bearish candle. Then, a small-bodied candle (the “star”) showing indecision. Finally, a long bullish candle confirming the reversal. The star can gap down from the first candle, showing that the downtrend is exhausted.
Piercing PatternA two-candle bullish reversal where the second candle opens below the first candle’s low but closes above the midpoint of the first candle’s body. It shows buyers aggressively stepping in after a selloff.
Bearish Reversal Patterns
These patterns appear after an uptrend and suggest that sellers are taking control:
Shooting Star
A small body near the bottom of the range with a long upper wick. It looks like an inverted hammer. The long upper wick shows that buyers pushed price up significantly, but sellers overwhelmed them and closed near the low. This signals potential bearish reversal.
Bearish Engulfing
The opposite of bullish engulfing. A bullish candle followed by a larger bearish candle that completely engulfs it. Shows that sellers have taken complete control.
Evening Star
The bearish counterpart to morning star. A long bullish candle, followed by a small indecision candle, followed by a long bearish candle. Signals a top and potential reversal.
Dark Cloud Cover
A two-candle pattern where the second candle opens above the first candle’s high but closes well into its body. Shows sellers aggressively pushing back after a rally.
Candlestick patterns aren’t magic. They work because they reflect genuine psychological dynamics between buyers and sellers:
Long wicks show rejection. When price shoots up but closes lower, it means buyers tried to push higher and failed. When price drops but closes higher, sellers failed to maintain control.
Small bodies show indecision. A doji (where open and close are nearly equal) shows that neither buyers nor sellers could gain control. It often precedes significant moves.
Large bodies show conviction. A long green candle means buyers were dominant throughout the period. A long red candle means sellers were in complete control.
By learning to read these patterns, you can see before indicators turn what the crowd is actually doing — not what they say they’re doing.
Confirmation Is Critical
Nison’s most important warning: never trade on candlestick patterns alone. Candlestick signals work best when confirmed by:
Volume confirmation — A breakout on heavy volume is much more reliable than one on weak volume
Western indicators — Moving averages, RSI, MACD, and trendlines provide additional context
Trend context — A bullish reversal pattern is more meaningful in an established downtrend than in sideways chop
Support and resistance levels — Patterns forming at key levels are more significant than those in the middle of nowhere
The synergy of Eastern candlestick patterns and Western technical tools creates a more robust trading strategy. Candlesticks don’t replace traditional analysis — they enhance it.
Risk Management and Strategy
Candlestick patterns are most valuable for:
Entry timing — Identifying optimal moments to enter positions
Exit timing — Recognizing when a trend may be ending
Stop-loss placement — Using pattern structure to set logical risk levels
Trend assessment — Determining whether a market is trending, reversing, or consolidating
For short- to medium-term traders (daily and weekly charts), candlestick patterns are particularly powerful. They’re less effective on very short timeframes where noise dominates, and they should always be used with proper risk management.
Key Takeaways
Candlestick charts offer unique visual insight into market sentiment and reversals.
Over 50 patterns exist, but a core group provides the highest reliability.
Best used in confluence with trend analysis, volume, and Western indicators.
Patterns are not predictive guarantees — they’re tools to assess probabilities.
Mastery requires pattern recognition, discipline, and market context.
Ready to Read the Market’s Mind?
Japanese candlestick charting isn’t just about memorizing patterns — it’s about understanding the human psychology behind price movements. Every candle tells a story. Every pattern reveals a battle. And every skilled trader learns to read these stories in real-time.
Want more insights on technical analysis, trading patterns, and market psychology? Explore The Summary Series by Dominus Code — where we distill the world’s best trading and investing books into practical wisdom.
This article was inspired by Japanese Candlestick Charting Techniques by Steve Nison — the foundational English-language work that introduced Japanese candlestick charts to Western financial markets.