The Ancient Japanese Secret to Mastering Stock Charts
What if the secrets to building real wealth were hidden in plain sight? In this article, we explore the transformative ideas from Japanese Candlestick Charting Techniques: A Contemporary Guide to the Ancient Investment Techniques of the Far East by Steve Nison — and how you can apply them to your own financial journey.
Steve Nison’s Japanese Candlestick Charting Techniques is the foundational English-language work introducing Japanese candlestick charts to Western financial markets. The book merges centuries-old Eastern trading wisdom with modern technical analysis, demonstrating how candlesticks can enhance trend analysis, spot reversals, and sharpen timing decisions in stocks, forex, futures, and other asset classes.
It has become a classic resource for traders and technical analysts, offering both the theory and practical application of candlestick patterns.
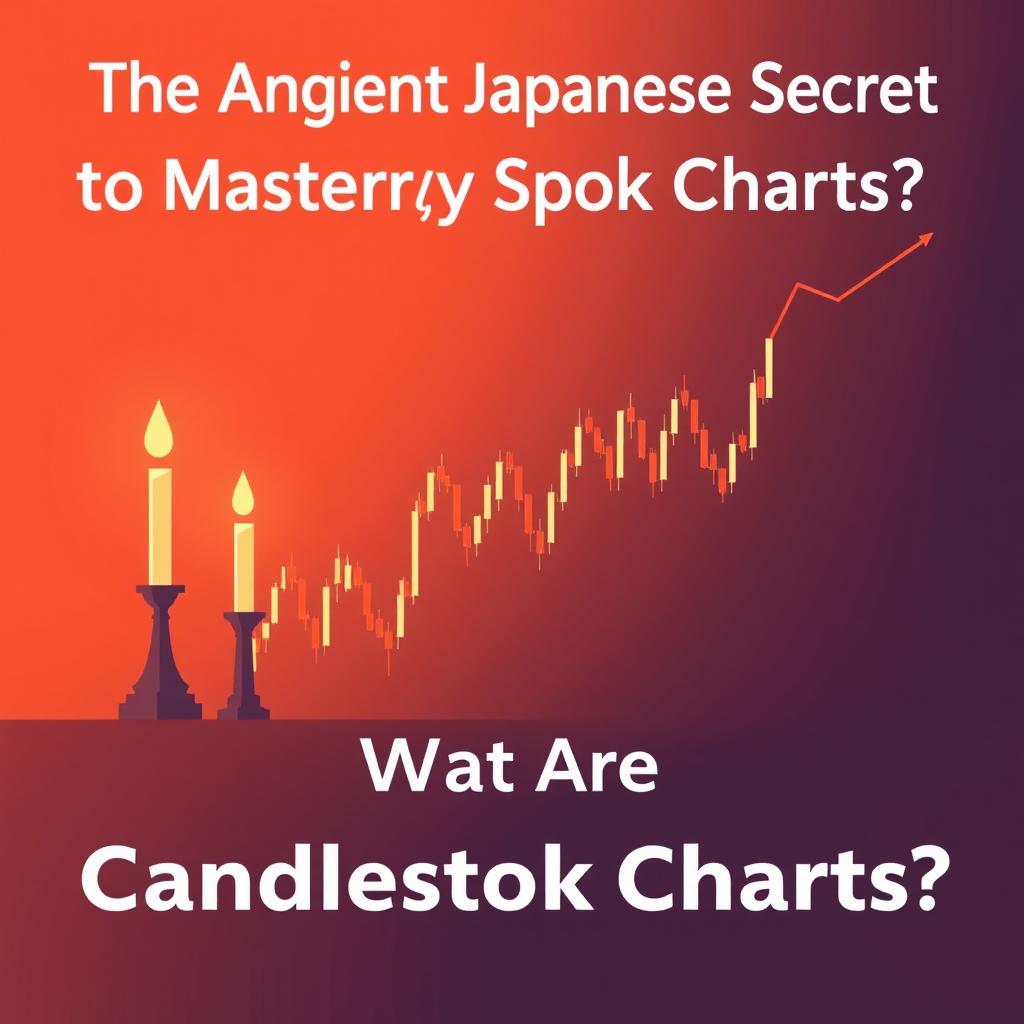
What Are Candlestick Charts?
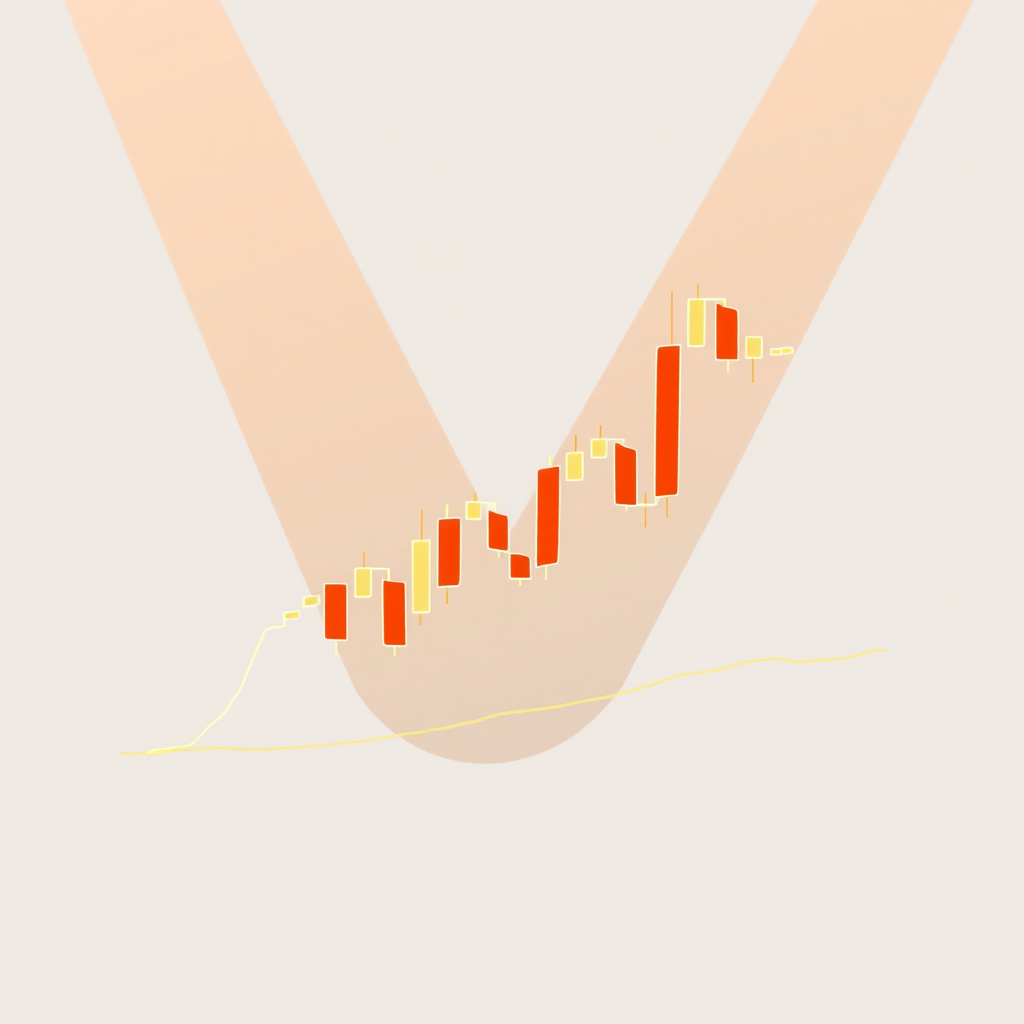
Candlestick charts originated in 18th-century Japan, used by rice traders to track market sentiment. Each candlestick represents price action for a single time period, showing:
- Open, High, Low, Close
- Real body: difference between open and close
- Shadows (wicks): extremes of the trading session
Compared to bar charts, candlesticks visually highlight market psychology and momentum shifts more clearly.
Key Components of Candlestick Patterns

1. Bullish Patterns
Hammer: Small body, long lower wick → potential bullish reversal
Engulfing Bullish: Large white candle engulfs previous black candle
Morning Star: Three-candle pattern signaling bottoming out
Piercing Pattern: White candle closes above the midpoint of a preceding black candle
2. Bearish Patterns
Shooting Star: Small body, long upper shadow → potential bearish reversal
Bearish Engulfing: Large black candle covers prior white candle
Evening Star: Three-candle top pattern indicating trend reversal
Dark Cloud Cover: Black candle opens above white candle but closes well into its body

Core Concepts & Lessons
1. Market Psychology Visualized
Candlesticks reflect buyer/seller emotions, not just price points.
Example: A doji (where open ≈ close) shows indecision or trend weakening.
2. Confirmations Are Critical
Nison warns against trading on patterns alone. Candlestick signals work best:
- With volume confirmation
- In conjunction with Western indicators (e.g., RSI, trendlines)
- Within the context of existing trends
3. Combining East & West
The book emphasizes synergy:
- Japanese candlesticks + Western technical tools (moving averages, support/resistance) = more robust trading strategy
- Candlesticks do not replace, but complement, traditional charting methods
4. Risk Management & Strategy
- Use candlestick patterns to refine entry/exit timing
- Combine with stop-loss discipline and trade planning
- Ideal for short- to medium-term traders (daily/weekly charts)
Key Takeaways
Candlestick charts offer unique visual insight into market sentiment and reversals
Over 50+ candlestick patterns exist, but only a core group are highly reliable
Best used in confluence with trend analysis, volume, and Western indicators
Patterns are not predictive guarantees, but tools to assess probabilities
Mastery requires pattern recognition, discipline, and market context
Final Thoughts
Japanese Candlestick Charting Techniques is a must-read for any serious technical trader or market analyst. Steve Nison doesn’t just introduce patterns—he teaches how to interpret the psychology behind them, making this an enduring classic in market education.
Ready to Learn More?
Want more insights on finance, investing, and wealth-building? Explore The Summary Series by Dominus Code — where we distill the world’s best finance books into practical wisdom.
This article was inspired by Japanese Candlestick Charting Techniques: A Contemporary Guide to the Ancient Investment Techniques of the Far East by Steve Nison.